Datalogging Basics
Introduction
Tuning your car, ultimately, is a scientific endeavor. Without accurate data, you have little if anything to inform your decisions (inputs) to your tune as you reform it to meet your goals. Data-logging is an important method to receive feedback from the ECM (engine control module) for your engine's current condition and performance as it relates to your calibration (tune) on the vehicle.
Typically, a datalog is the recording of a series of values (or parameters) that are read (or polled) from the vehicle at a specific interval, or polling rate. Parameters included in a data log might be, for example, the engine speed (RPM), rate of mass air entering the intake tract (mass airflow, or MAF), ignition advance (or ignition timing), the air-fuel target ratio (or commanded AFR), coolant temperature, camshaft phase/timing, and so on. Each of these parameters are requested at once by your tuning software, such as Atlas, at a certain frequency schedule typically measured in polls-per-second or hertz (Hz). The higher the polling rate, the higher the precision is in the time domain for logged values.
The ECM records these values to Atlas by first briefly pausing the execution of the ECM logic, reading every value requested, and assembling all requested parameters in a single frame that is transmitted back to Atlas over the vehicle's communication system (typically the CAN bus). Atlas then records the date and time that the individual frame was received and adds it to the list of frames, which together form the recording.
The same system that is used to display gauges in Atlas is used for data-logging. The difference is these received (polled) frames are recorded for later viewing, as opposed to gauges which only use any given frame to update the gauge's corresponding parameter value and throw away the received data after it has been displayed on screen.
Atlas Datalogger
To open the Data Logging window, press Control + D (Cmd+D on MacOS) or click the ![]() button in the Atlas toolbar.
button in the Atlas toolbar.
The Atlas Datalogger makes recording and viewing datalogs easy. At a high level, these are the headline features of the Atlas data logging ecosystem and why we think you should use it:
- Snappy, hardware-accelerated, optimized data and graphics pipeline based on OpenGL capable of easily presenting and navigating logs in excess of 30 minutes in length at any polling rates. You can load up our data-logger with well over 100,000 data-points on commodity hardware with next-to-zero screen lag on battery power.
- Community-friendly unencrypted Atlas Datalog Format (*.ADL file) that flexibly allows you to share your compressed logs for opinion and review with our community members.
- Easily export CSVs that can be imported into websites like https://datazap.me/.
- End-to-end 64bit nanosecond resolution from the recording, to the saved format (.ADL), to the rendered view.
- 32-bit floating point resolution for all parameters.
- Automatic unit conversion to your Atlas preferences (see File -> Atlas Settings).
- Live viewing while recording is on-going.
- Tailored interpolation style for the time axis based on the individual precision of each logged parameter.
- Automatic Y axis scaling and grouping for all parameters in a track. Parameters in a track with equivalent units will automatically be scaled relative to each-other, while other units will not.
- Strong emphasis on a dark theme and designed to reduce judder and flashing to make it easier on your eyes when you're tuning late at night.
- Design & create your own analytical/mathematical formulas to mix any data-logged parameters together, and add them post-recording as their own tracks with full support for all actions across the data logger.
- Quickly generate beautiful 3D scatter plots and histograms from any logged data for deeper analysis.
Main Layout
| Area |
Description |
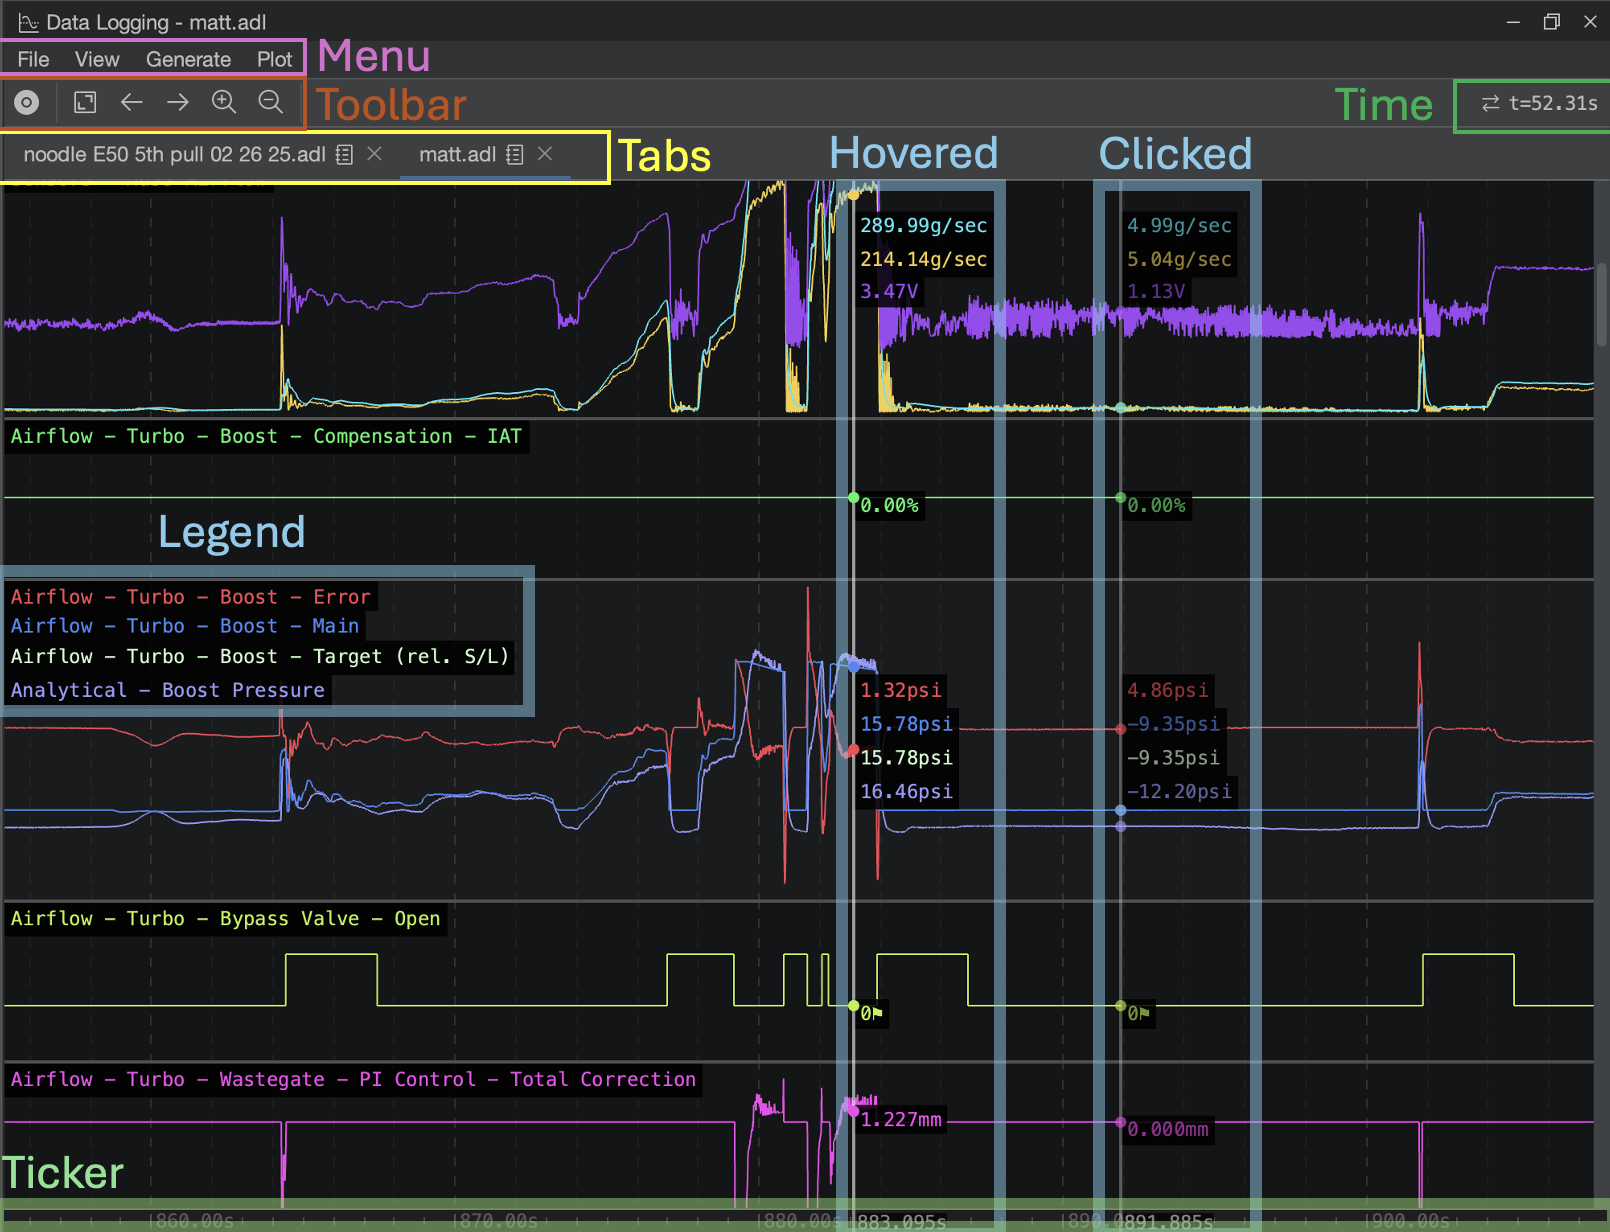
| Menu | Access actions in the Data Logging window, such as loading and saving datalogs, exporting CSVs, changing the view of the displayed log, and generate tables and charts. |
| Toolbar | Offers quick actions such as recording a new datalog and navigating around the current log. |
| Time | Shows the currently shown timespan, in seconds, for the visible portion of the current log, and also a time delta if a marker has been placed. |
| Tabs | Allows you to open multiple logs at once and quickly switch between them. Each log occupies its own tab. |
| Tracks | A datalog is comprised of parameters in tracks. Tracks are stacked vertically on top of eachother in the datalogger, and by default are sorted alphabetically. These tracks may optionally be grouped together by control + clicking them and right-clicking them to group them. |
| Hovered | As the cursor is moved (or "scrubbed") across the log horizontally, a marker is shown that interpolates the value at the hovered location for all tracks. |
| Clicked | When an interesting point in the log is identified, click once with your mouse to place down a marker. Markers are useful to keep yourself aligned in the datalogger. |
| Legend | A legend is shown in each track to indicate which parameters are shown in the track. Each label's vertical position corresponds to the vertical positioning of all values shown next to each marker as you scrub your mouse or place a marker to make it an easy way to reference which value is which in a grouped track. |
| Ticker | A ticker is shown at the bottom of the log to help keep you oriented and referenced to the timing of events in your log. All logs start at 0 (zero) seconds and extend for the duration of the recording to the right. |

