Datalogging
Atlas Datalogging Basics
Introduction
Tuning your car, ultimately, is a scientific endeavor. Without accurate data, you have little if anything to inform your decisions (inputs) to your tune as you reform it to meet your goals. Data-logging is an important method to receive feedback from the ECM (engine control module) for your engine's current condition and performance as it relates to your calibration (tune) on the vehicle.
Typically, a datalog is the recording of a series of values (or parameters) that are read (or polled) from the vehicle at a specific interval, or polling rate. Parameters included in a data log might be, for example, the engine speed (RPM), rate of mass air entering the intake tract (mass airflow, or MAF), ignition advance (or ignition timing), the air-fuel target ratio (or commanded AFR), coolant temperature, camshaft phase/timing, and so on. Each of these parameters are requested at once by your tuning software, such as Atlas, at a certain frequency schedule typically measured in polls-per-second or hertz (Hz). The higher the polling rate, the higher the precision is in the time domain for logged values.
The ECM records these values to Atlas by first briefly pausing the execution of the ECM logic, reading every value requested, and assembling all requested parameters in a single frame that is transmitted back to Atlas over the vehicle's communication system (typically the CAN bus). Atlas then records the date and time that the individual frame was received and adds it to the list of frames, which together form the recording.
The same system that is used to display gauges in Atlas is used for data-logging. The difference is these received (polled) frames are recorded for later viewing, as opposed to gauges which only use any given frame to update the gauge's corresponding parameter value and throw away the received data after it has been displayed on screen.
Atlas Gauges
The Atlas workflow separates parameters (things we define for you) as objects you can parameterize and log, called gauges. In Atlas, gauges -- though each based their own parameters -- are what are used for recording, not parameters themselves. You can customize gauges to your preference, including their theme, style, alarms (i.e. flashing), and scaling limits. To further help you organize your workspace, your customized gauges are grouped into something called a gauge set, or a collection of your gauges.
To access your gauge sets, look to the right of Atlas. If the panel is closed, you will notice a vertical strip of tabs, one of which is called Gauges. Click this to open your gauges and gauge sets.
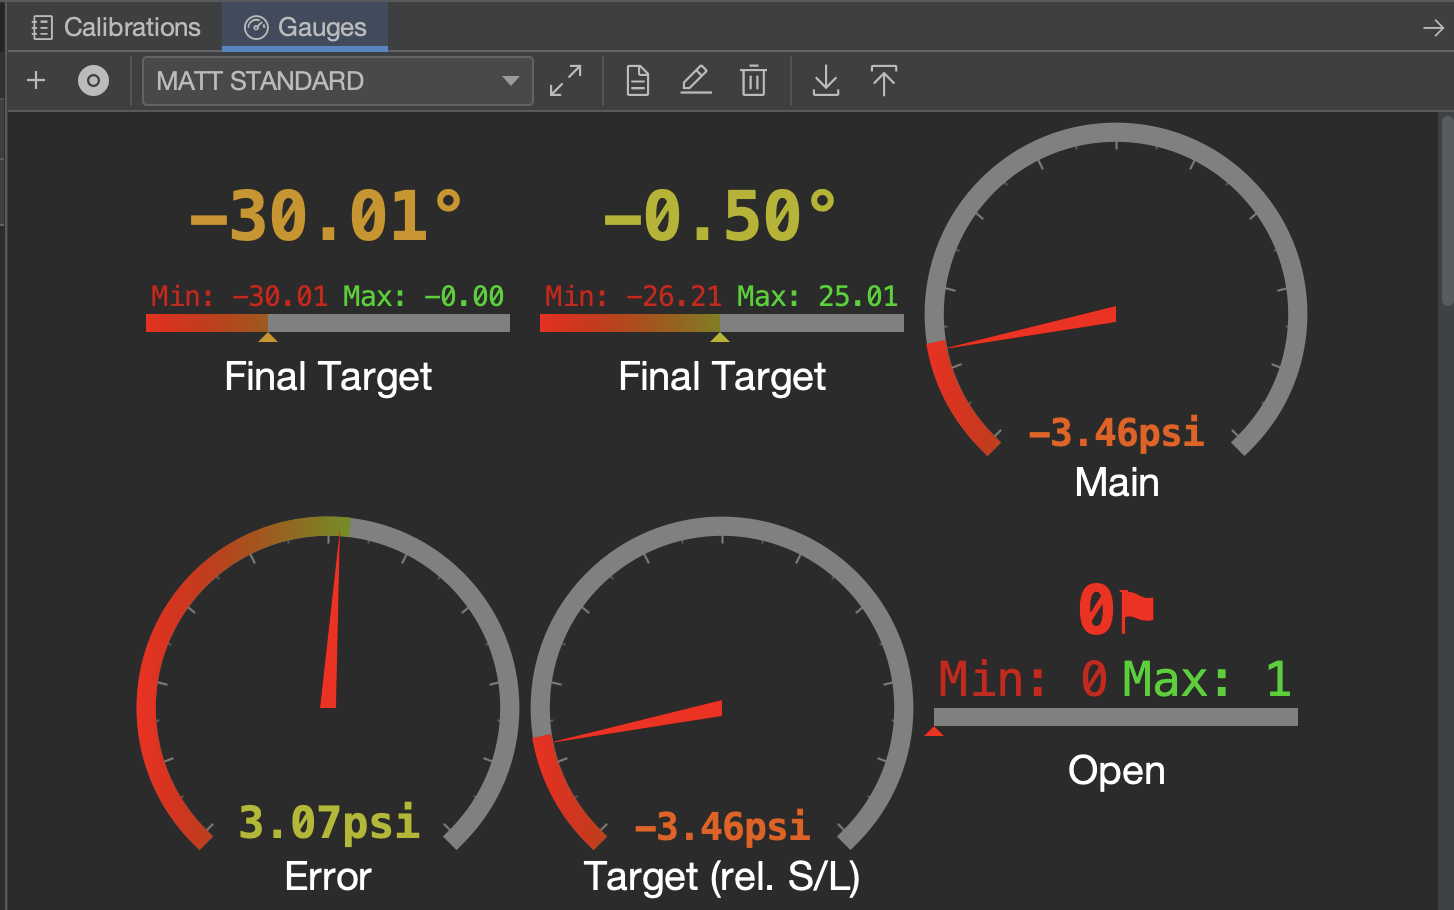 |
Gauge sets can be used to organize your workflow and the parameters you want to see when you are tuning on the weekend, driving to work, or perhaps logging on a track day. Some users prefer to have just one gauge set, while others prefer to have multiple for troubleshooting difficult tune problems that require one of our plethora of development-level parameters to trace.
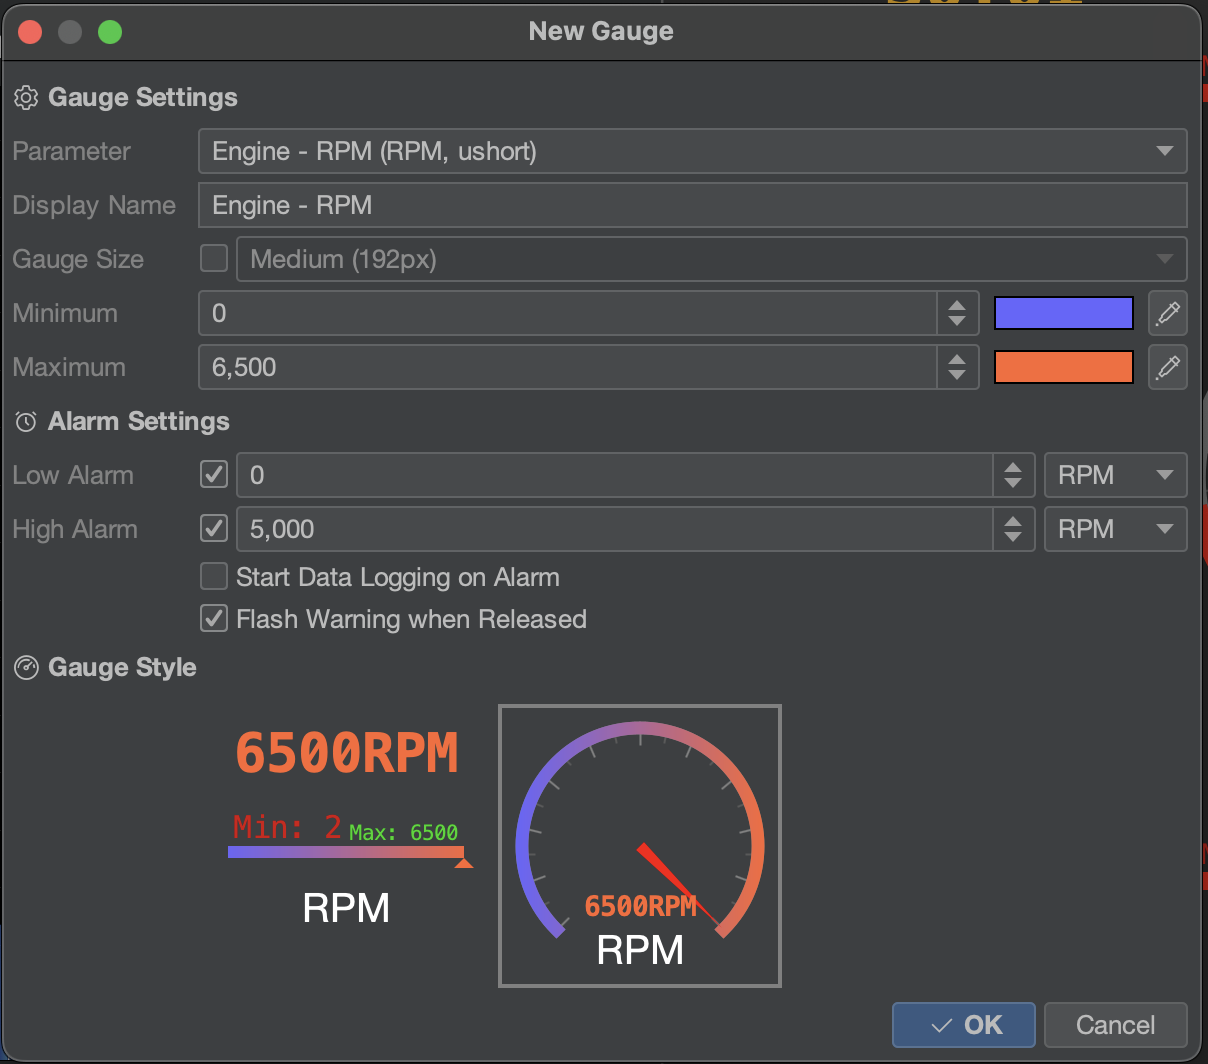
To add a gauge, use the ![]() button.
button.
 |
|
Atlas Datalogger
To open the Data Logging window, press Control + D (Cmd+D on MacOS) or click the ![]() button in the Atlas toolbar.
button in the Atlas toolbar.
The Atlas Datalogger makes recording and viewing datalogs easy. At a high level, these are the headline features of the Atlas data logging ecosystem and why we think you should use it:
- Snappy, hardware-accelerated, optimized data and graphics pipeline based on OpenGL capable of easily presenting and navigating logs in excess of 30 minutes in length at any polling rates. You can load up our data-logger with well over 100,000 data-points on commodity hardware with next-to-zero screen lag on battery power.
- Community-friendly unencrypted Atlas Datalog Format (*.ADL file) that flexibly allows you to share your compressed logs for opinion and review with our community members.
- Track grouping and splitting that saves your grouping preferences for future logs.
- Easily export CSVs that can be imported into websites like https://datazap.me/.
- End-to-end 64bit nanosecond resolution from the recording, to the saved format (.ADL), to the rendered view.
- 32-bit floating point resolution for all parameters.
- Automatic unit conversion to your Atlas preferences (see File -> Atlas Settings).
- Live viewing while recording is on-going.
- Tailored interpolation style for the time axis based on the individual precision of each logged parameter.
- Automatic Y axis scaling and grouping for all parameters in a track. Parameters in a track with equivalent units will automatically be scaled relative to each-other, while other units will not.
- Strong emphasis on a dark theme and designed to reduce judder and flashing to make it easier on your eyes when you're tuning late at night.
- Design & create your own analytical/mathematical formulas to mix any data-logged parameters together, and add them post-recording as their own tracks with full support for all actions across the data logger.
- Quickly generate beautiful 3D scatter plots and histograms from any logged data for deeper analysis.
Main Layout

| Area |
Description |
| Menu | Access actions in the Data Logging window, such as loading and saving datalogs, exporting CSVs, changing the view of the displayed log, and generate tables and charts. |
| Toolbar | Offers quick actions such as recording a new datalog and navigating around the current log. |
| Time | Shows the currently shown timespan, in seconds, for the visible portion of the current log, and also a time delta if a marker has been placed. |
| Tabs | Allows you to open multiple logs at once and quickly switch between them. Each log occupies its own tab. |
| Tracks | A datalog is comprised of parameters in tracks. Tracks are stacked vertically on top of eachother in the datalogger, and by default are sorted alphabetically. These tracks may optionally be grouped together by control + clicking them and right-clicking them to group them. |
| Hovered | As the cursor is moved (or "scrubbed") across the log horizontally, a marker is shown that interpolates the value at the hovered location for all tracks. |
| Clicked | When an interesting point in the log is identified, click once with your mouse to place down a marker. Markers are useful to keep yourself aligned in the datalogger. |
| Legend | A legend is shown in each track to indicate which parameters are shown in the track. Each label's vertical position corresponds to the vertical positioning of all values shown next to each marker as you scrub your mouse or place a marker to make it an easy way to reference which value is which in a grouped track. |
| Ticker | A ticker is shown at the bottom of the log to help keep you oriented and referenced to the timing of events in your log. All logs start at 0 (zero) seconds and extend for the duration of the recording to the right. |
Scatter Plots & Histograms
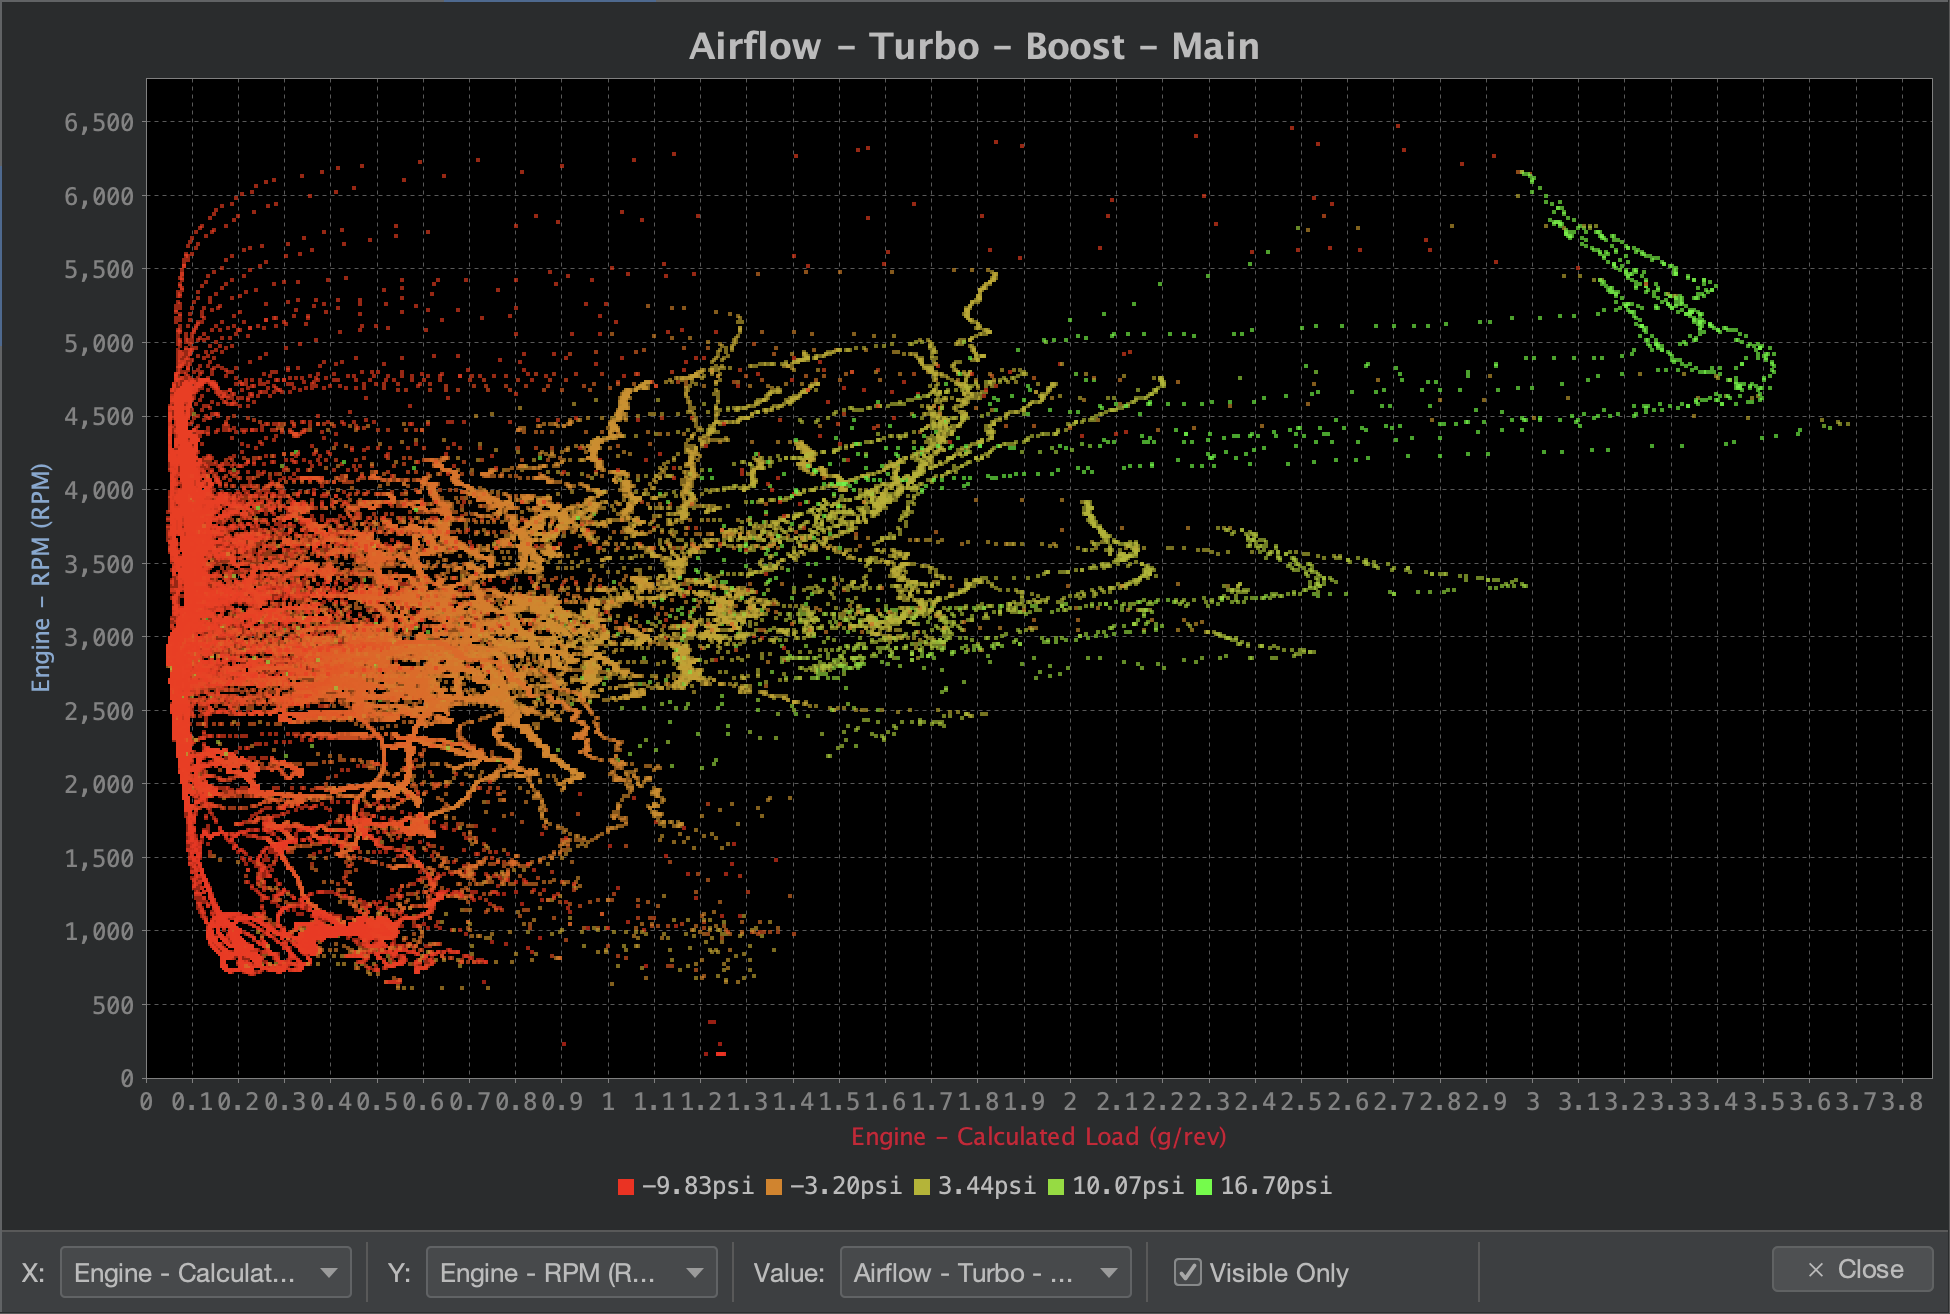
Scatter Plots
In order to provide you with more insight into your data, Atlas offers the ability for you to generate scatter plots. By plotting each data frame as a shaded point on a 2D surface, Atlas can give you insight to three mixed dimensions of data at once. To generate a scatter plot, right-click a track in the main data log view and click "Plot Scatter." The parameter you select will be preloaded into the X, Y, and Value (shading) fields, and you can refine your scatter plot from there. Right click on the plot to also save the plot as a PNG file.
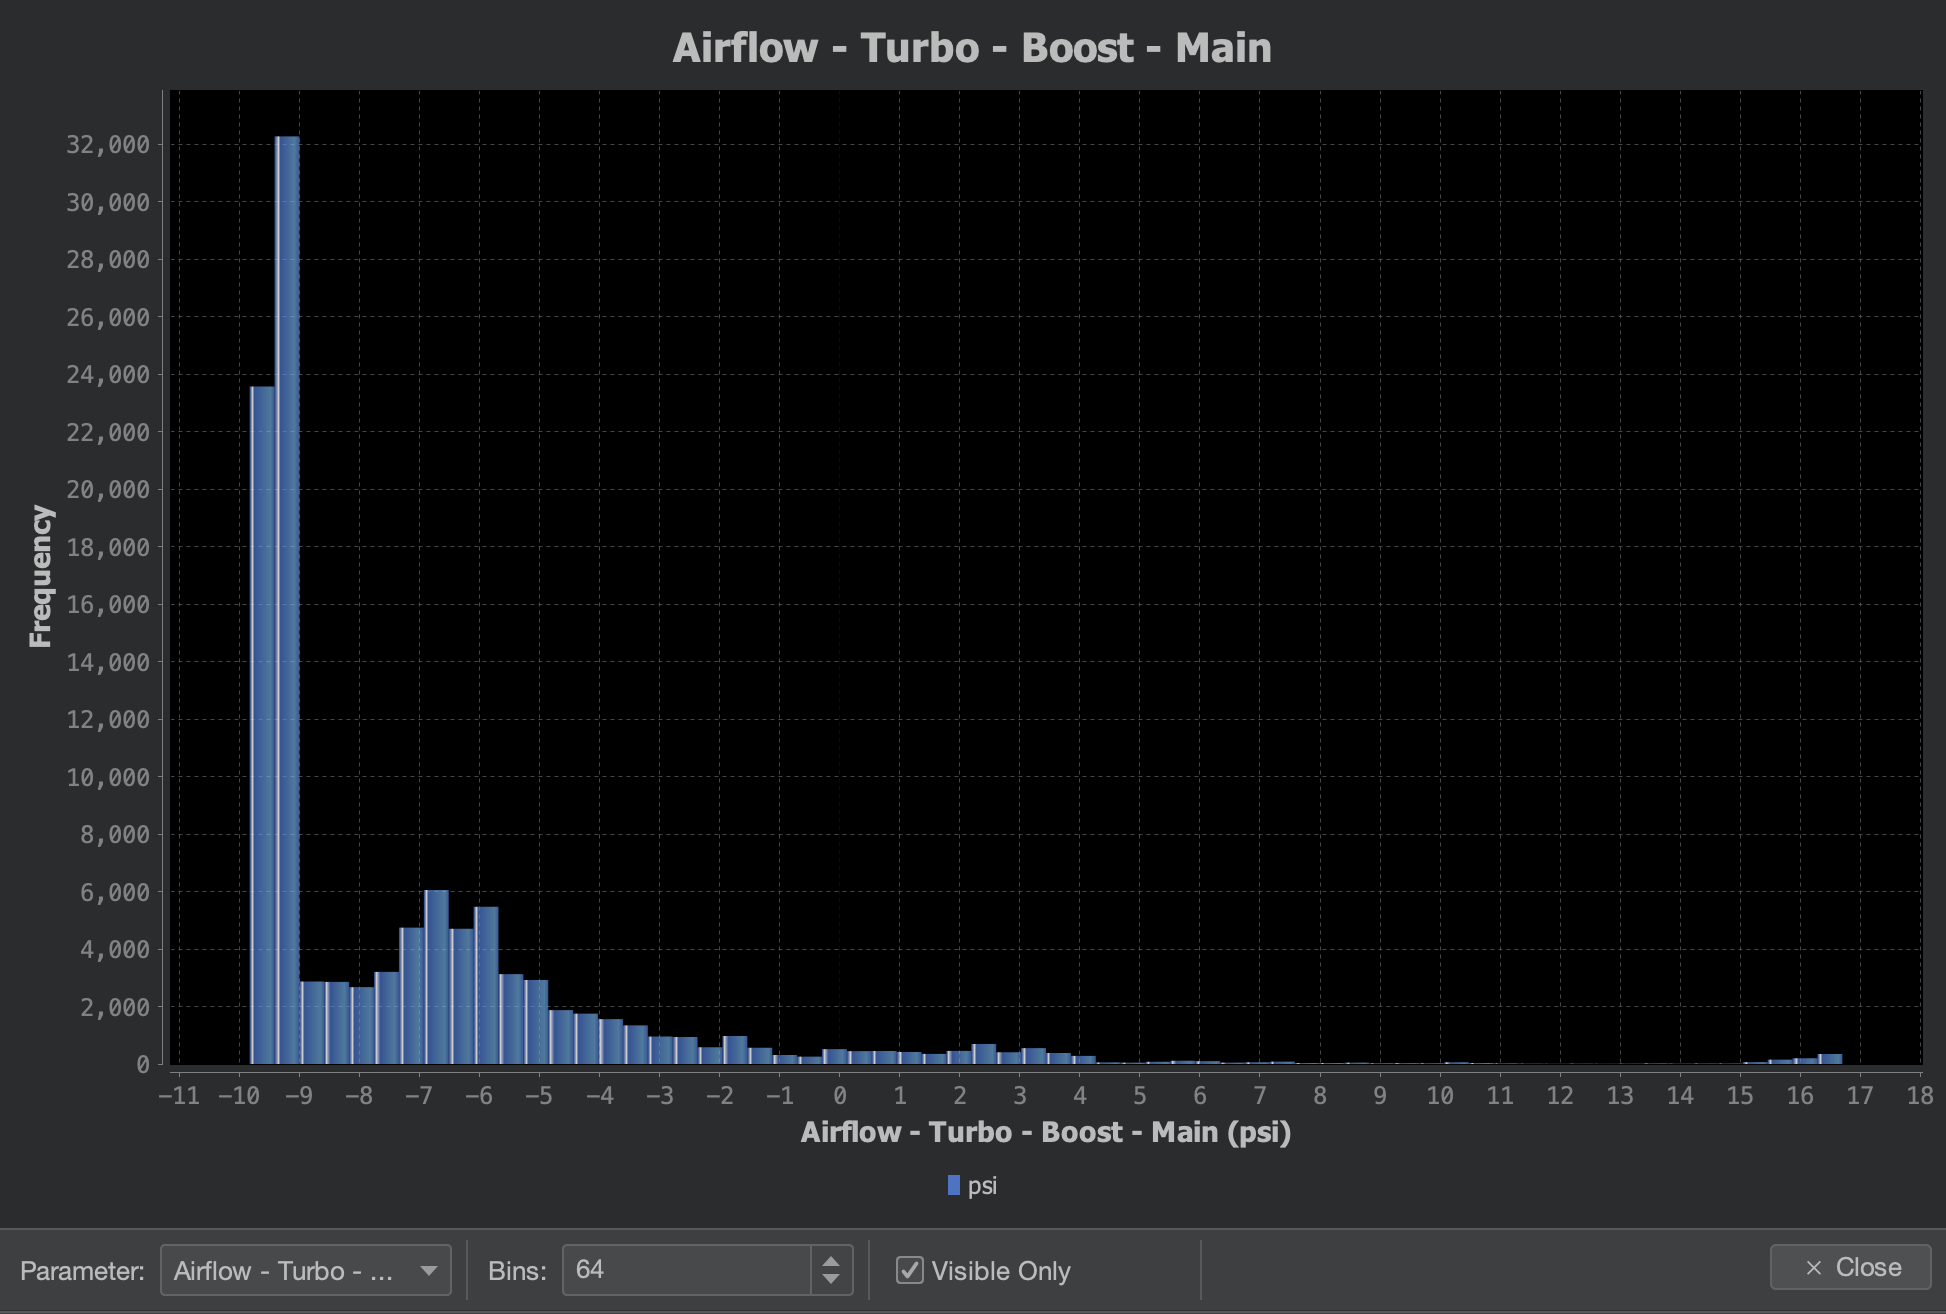
Histograms
Similarly to Scatter Plots, right-click a track in the data log view to plot a histogram.
Navigating Atlas & Parameter Names
Introduction
When designing or data-logging a tune, it is important to not only record accurate datapoints and modify the right tables, but it is also critical that you understand what each data stream (or parameter) and table is referencing. For example, data-logging a "Ignition Timing Base Final" parameter is not referencing the same ignition timing value as logging your tune's "Ignition Timing Commanded Final" parameter. Base Final =/= Commanded Final.
Atlas as a platform is designed to emphasize very granular access to ECU logic, and therefore the definitions we release to the public are often more detailed and expansive than you may be familiar with on other platforms. Due to the increasing complexities of modern ECUs, we choose to offer definitions that give you more access in between distinct pipeline elements of all tuning areas we support. Our objective is to give you everything you need to work around OEM behavior and logic and be able to ground your understanding of the ECU logic in lower-level parameters if you choose to do so.
Having more data points to log and more tables to edit does introduce a steeper learning curve, and so our definitions can be more confusing to navigate and comprehend quickly and may take longer to get familiarized with. However, we do have several systems in place that will assist you in getting comfortable with the Atlas workflow.
Navigating Atlas
Advanced Parameters
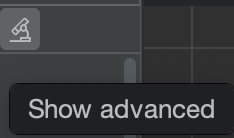
We have a system that allows you to filter generally unimportant tables and parameters. For these unimportant items, we will mark them as advanced. By default, Atlas doesn't show advanced parameters and tables as most tuners are not trying to get quite as specific as these elements offer. You can either choose to show or hide these based on the level of granularity you are looking for in your tune by using the Show advanced button in the project tree tab.
Here are some examples of advanced items:
- Tables (or maps) that are seldom, if ever, modified in a general street tune, but have some theoretical benefit or purpose to very specific applications or scenarios.
- Flags or modes that are generally only needed when diagnosing specific tune logic issues, such as operating mode numbers, esoteric low/high signals, or decision outputs needed during development of the definition for quality assurance purposes.
- Parameters that are highly granular, such as those used between pipeline stages. An example of this might be the "Table" output of a table that has been directly computed by the ECU, perhaps after blending operations (i.e. TGV & AVCS).
Documentation Graphs
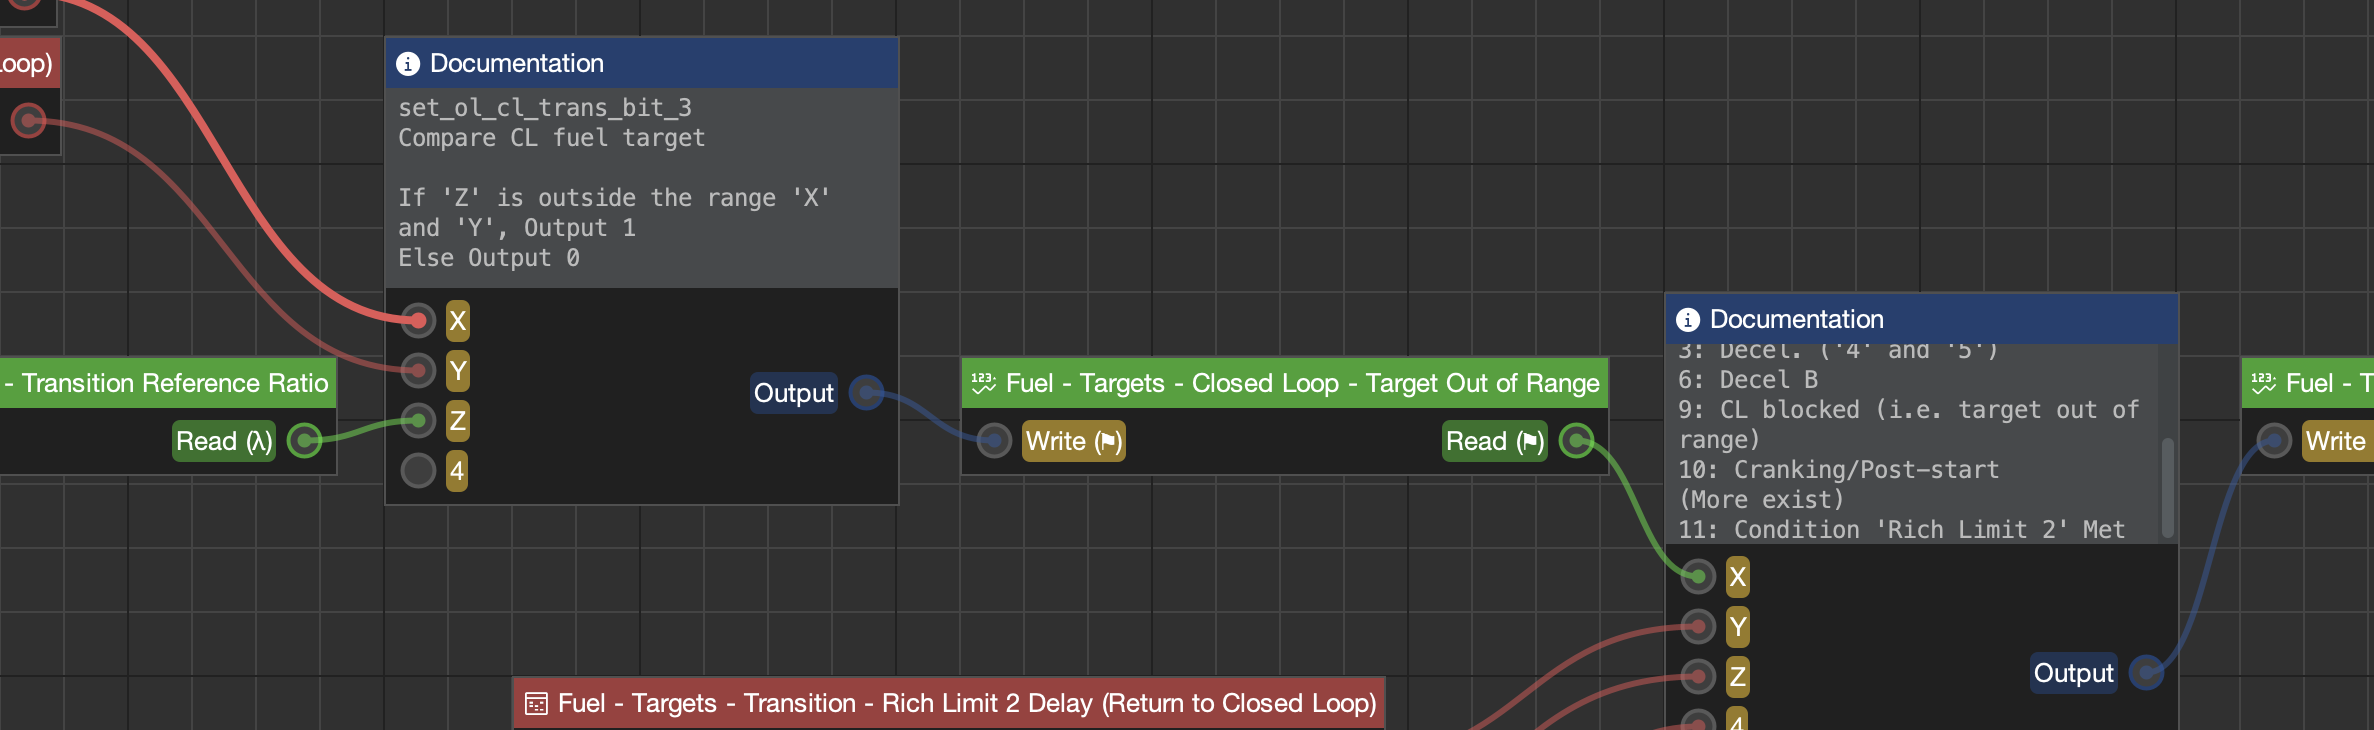
Additionally, Atlas is designed with a built-in graph editor that we use to create illustrations of ECU logic for you to explore. Laid out from left to right, several graphs are available in supported definitions that demonstrate the data flow of decisions in specific areas of ECU logic (i.e. Fuel, Ignition, Wastegate, etc.). If you are unfamiliar with tuning a platform, we strongly recommend taking a look at these. If you'd like to look up a table or parameter in a graph, right-click it in the project tree and click Find in Graph. This will automatically open the corresponding documentation graph, center the parameter or table you are searching for, and highlight it with a flash of yellow.
Parameter Names
Atlas does not have a strict standard for naming rules, but we do offer a dictionary of terms that assists in developing a loose standard for helping end-users understand what each parameter is intended to imply to you.
|
Naming |
Description |
Example |
|
Table or Base Table |
The value immediately after performing table lookup and any associated blending has been applied. For example, in the case of Subarus, this would be the result of all associated TGV and AVCS blending has been calculated on a given 4- or 5-dimensional map. |
Ignition - Primary - Base Table |
|
Base Base Final Final |
For different stages of a pipeline, Base and its corresponding Base Final may be used to distinguish distinct book-ends of a pipeline operation. For example, when combining ignition timing, there may be a "Combine Base" and a corresponding "Combine Final". It is also possible for parameters to be named simply as "Base" and "Base Final"
|
Idle - Target Airflow - Base - Base
Idle - Target Airflow - Base - Base Final |
|
Corrected |
For referential data in the ECU, and especially for the Mass Airflow (MAF) sensor, Corrected is used to name the corrected value of some base parameter, and is generally used by the ECU instead of a corresponding base parameter for its own calculations. |
Airflow - MAF - Mass Airflow Corrected (g/sec, uint) |
|
Primary Secondary |
These are placeholder names that names a parameter whose behaviors and relevance have been yet-uncharacterized. |
|
|
Target |
Target is used to name a parameter that the ECU will reference through some other proportional/integral control system; this is also knows as the set-point in closed loop control systems. Targets are not commanded to the hardware electrically.
A target might be, for example, the target airflow used to determine the commanded throttle position. Note that in this example, the target isn't commanded to the hardware, but the throttle position references the target and is commanded instead.
Another example would be boost. Boost pressure cannot be commanded; instead, the waste-gate position is 'Commanded' by using the boost target and target torque as a wastegate position table that is then adjusted through its own closed (or open) loop control system, referencing the 'Main Boost Target' table as the set point.
Targets may themselves be split into their own Target Base and Target Final sub-parameters. In these cases, Target Final will be the target that is referenced by the ECU for closed loop control, while Target Base is left in the definitions for diagnostic purposes and will likely be marked as advanced. |
Idle - Target Airflow - Target Base (g/sec, ushort)
Fuel - Targets - Closed Loop - Target Final (λ, ushort)
|
|
Commanded Final |
For parameters that involve digital to analog conversion (DAC), such as ignition timing and fuel pulse width, Commanded Final references the last available value before the ECU physically commands the associated hardware elements to take action. No other modifications or alterations of the value takes place in the pipe-line after this point.
In the case of ignition timing, this would be the amount of time referenced to determine a timer delay for ignition spark from the MCU.
For direct injection fuel platforms, this would be the pulse width of the signal sent to the injectors through any associated amplification hardware present on the ECU. |
Fuel - Pulse - Commanded Final
Ignition - Commanded Final
Airflow - Turbo - Wastegate - Position Commanded Final |